| Date | 01-Aug-26 | Hit | 3109 | ||||||||||||||||||||||||||||||||||
|
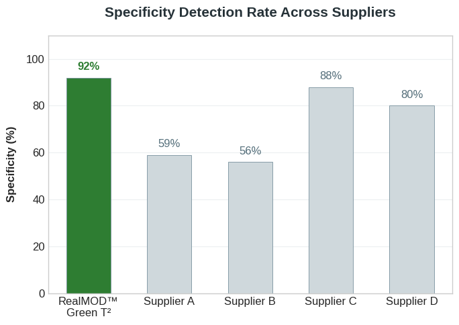
92%
Target Specificity
Universal ROX
Compatible with any equipment
< 40 min
One-Step Total Runtime
99.99%
Carryover Prevention
1
Product Lineup at a Glance
DNA Target
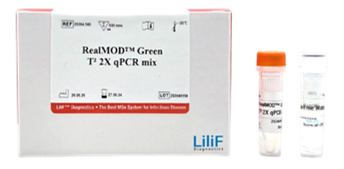
RealMOD™ Green T² 2X qPCR mixCat. No. 25364 · 200 / 500 rxns
RNA Target
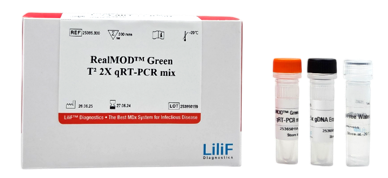
RealMOD™ Green T² 2X qRT-PCR mixCat. No. 25365 · 100 / 300 rxns
2
Advanced Chemistry & Core Formulations
The RealMOD™ Green T² Series incorporates an advanced chemistry matrix designed to eliminate sample dropouts at low template concentrations while suppressing non-specific, template-independent amplification. By integrating specialized enzyme stabilizers with a high-performance buffer system, this series guarantees absolute data integrity for critical research and molecular diagnostics.
Universal Instrument Compatibility
Pre-blended with a universal ROX passive reference dye. Performs seamlessly across low-ROX, high-ROX, and ROX-independent qPCR instruments without manual optimization.
Visual Verification Dye
Formulated with a non-interfering inert blue tracking dye for rapid visual confirmation of pipetting accuracy in multi-well plates, drastically reducing human loading errors.
Streamlined Two-Step Setup
Simply add primers and templates directly to the 2X master mix. Ready for immediate thermocycling, eliminating complex preparation protocols. Workflow Comparison & Acceleration
1. Sample Prep
DNA/RNA Extraction
2. RT Reaction
3 Minutes (Fast RT)
3. Amplification
Fast qPCR Run
4. Analysis & Results
Total < 40 Minutes
Conventional Workflow: ~80+ Min ➔ RealMOD™ Green T²: < 40 Min (Save over 1 hour of total runtime)
3
Data-Driven Performance Validation
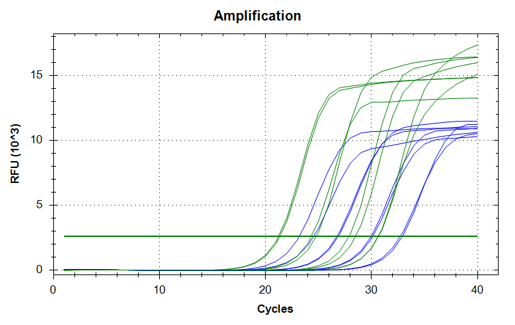
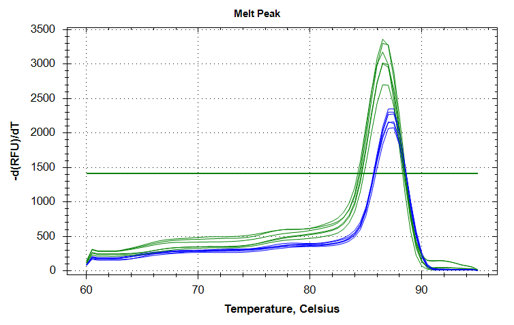
▶ RealMOD™ Green T² 2X qPCR mix
Performance Comparison vs. Competitor (GAPDH Target)
(A) Amplification Plot (FAM Channel)
(B) Melting Curve Profile
Comparison of 10-fold serial dilutions (5 ng to 50 pg) of human gDNA template: RealMOD™ Green T² demonstrates significantly earlier Ct values, higher plateau fluorescence intensity, and cleaner single-target amplification profiles compared to Supplier A.
Linear Dynamic Range and Target Specificity
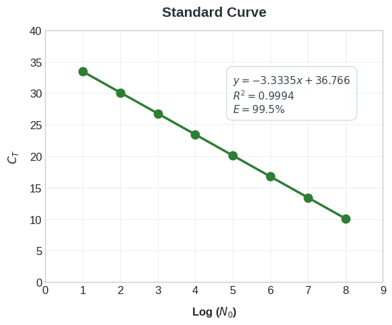
Standard Curve (Linearity)
R² = 0.9994 | E = 99.5%
Target Specificity Comparison
92% Specificity
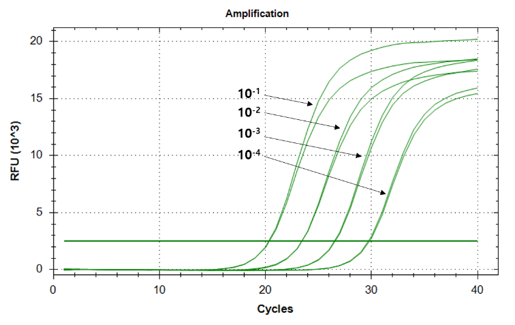
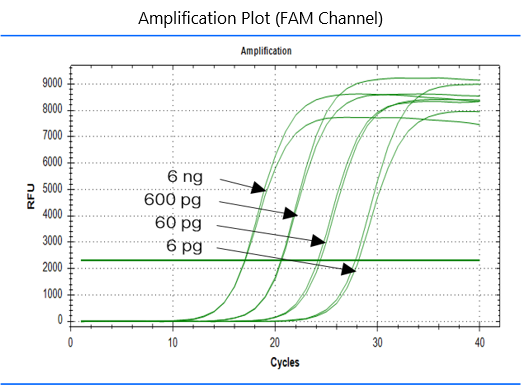
Amplification Plot (CPIV cDNA)
Single-copy detection
▶ RealMOD™ Green T² 2X qRT-PCR mix
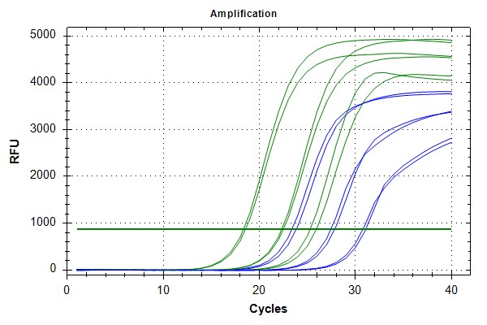
Performance Comparison vs. Competitor (K562 Total RNA, GAPDH Target)
(A) Amplification Plot (FAM Channel)
(B) Melting Curve Profile
Comparison of 10-fold serial dilutions (20 ng to 200 pg) of K562 cell total RNA: RealMOD™ Green T² 2X qRT-PCR Mix delivers earlier Ct values, superior final fluorescence yield, and high-specificity amplification curves compared to Supplier A.
Linear Dynamic Range & Carryover Contamination Control
Linear Dynamic Range for Viral Target (CPIV RNA)
Dilution Range: 6 ng to 6 pg
Carryover Contamination Control (dUTP/UDG System)
99.99% Prevention Efficiency
4
Ordering Information
iNtRON Biotechnology, Inc.
Global Leader in Molecular Diagnostics & Gene Extraction
Technical Support: tech@intronbio.com
Tel: 82-31-739-5741 | Fax: 82-31-5264
© 2026 iNtRON Biotechnology, Inc. All rights reserved. For research use only. Not for diagnostic use.
|
|||||||||||||||||||||||||||||||||||||